Cattle Squares & Goat Cubes
The importance of monitoring in estimating forage
by Ethan Young
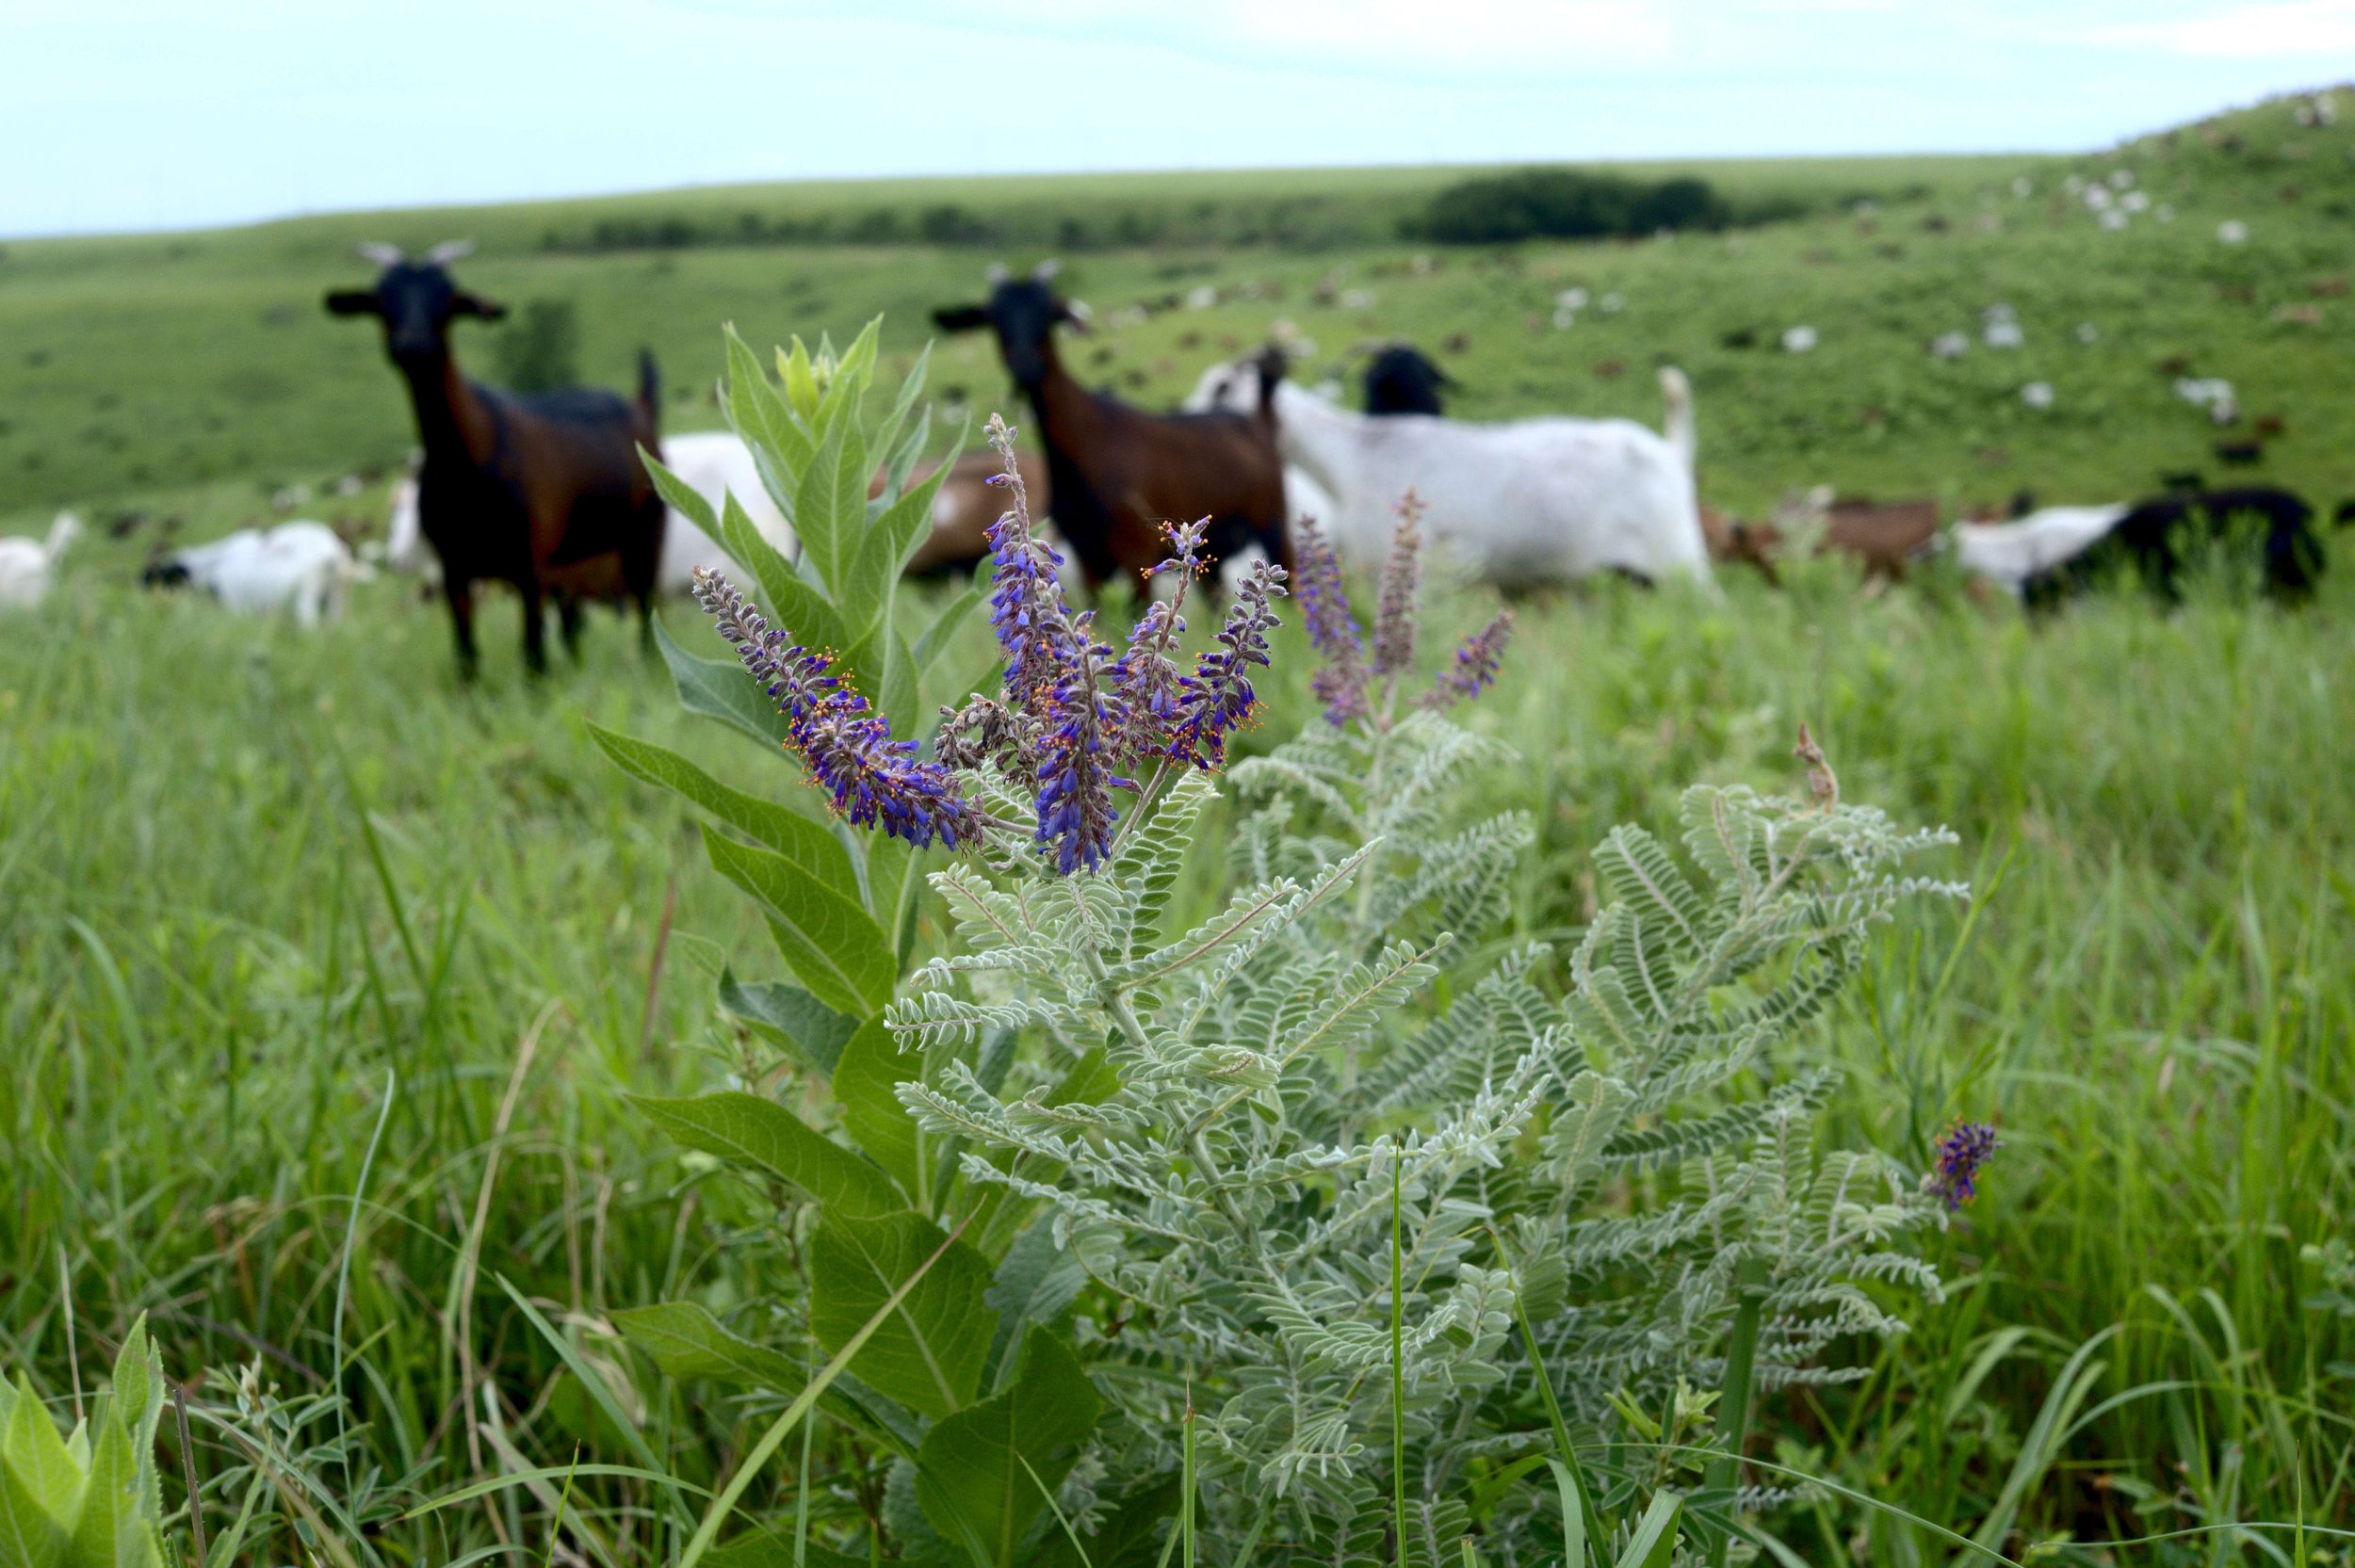
I remember it clearly: We thought we had lost the entire herd. There was no way that 1000 animals were huddling away from the thunder, lightning, hail and blowing wind of an early spring prairie storm in such a small grove of shrubs. But there they emerged, like an oversized group of clowns from an undersized clown car.

Author Ethan Young with goat herd.
Goats’ ability to pack themselves into tight spaces when they are motivated isn’t their only visually deceiving quality. They set themselves apart from their bovine and ovine counterparts as browsers who prefer to forage from the buds, flowers, leaves, and bark of taller woody species. When foraging, goats tend to “look forward and up,” in comparison to cattle, who tend to look “forward and down.” Sheep are often somewhere in the middle. According to Texas A&M Extension Service,
A typical goat diet consists of 45% grass, 12% forbs, and 43% browse
A typical sheep diet consists of 61% grass, 22% browse, and 17% forbs.
A typical cow diet will consist of 81% grass, 12% forbs, and 7% browse
There are many variations to these generally-true observations from differences in management, breeding, available forage, season, lifecycle and class, herd structure, social dynamics and nutritional wisdom, so it’s important not to use these figures as absolutes. A browse-heavy diet makes estimating forage rather difficult as compared to pasture-grazing animals, where we can use tools such as pasture squares or feed sticks to measure, calculate, and estimate the carrying capacity of a given plot of land. For goats, that “feed square” starts to look more like a “feed cube,” adding an extra dimension of complication to assessing quantity and quality. We might begin to ask ourselves:
How high does an “average” goat reach? At higher densities goats will tend to reach higher into the canopy but also eat lower on the plane of nutrition.
Does that account for teamwork between animals and other behavioral factors?
Different classes and breeds of goats behave and reach into the canopy differently
Can I visually estimate vertical as well as horizontal forage density?
How much of that apparent bulk is inedible lignin or empty air?
How does edibility, nutrition, and bulk change throughout the season amongst the horizontal and vertical dimensions of the feed cube?

Ethan explaining a night pen site to a visitor.
These factors can certainly add layers of complexity that might make one's head spin. However, all is not lost! Experienced pasture managers who diligently plan according to the principles of Holistic Management often quickly develop a sixth sense for the quality and quantity of forage available to their animals given the recent grazing history, time of year, and weather conditions. Fortunately, all the reasons that lead to the development of this sixth sense for cattle and sheep forage assessments also hold true for browsing animals.
How do they do this? In the simplest terms, they start with their best guess (assisted by pasture sticks or feed squares, or not) merely as an opening bid, and then they monitor, record, adjust, adapt, and replan. It really doesn’t matter much if we are just a little bit off or even significantly off with that first guess. What matters is that we develop and maintain the ability to adapt to constant feedback. So, what do we monitor to close the loop? Here’s a good start:
Pre- and post-graze pasture assessments:
What did it look like before the animals showed up? What did it look like after they left? How much forage material did they consume over the course of their stay in that area? What plants did they target or avoid at a given lifecycle or time of year? What other sort of non-grazing impacts did they have on vegetation and forage?
Animal behavior:
Do they seem content or discontent? Are they delayed or failing to ruminate? Are they “breaking out” or trying to get to places (or higher quality forage) they don’t have access to? Do they seem “low-headed” and lethargic or full of life?
Dung score (Including dag scoring for fiber-producing animals):
Do they maintain a balanced macronutrient intake? Do they seem sickly? Do the dung beetles like what they see (see also Brian’s example of dung scoring)?
Animal condition:
How’s their gut fill? Coat condition (slick vs rough), parasite burden (FAMACHA), bag fill (milk production) for lactating moms, vigor of offspring (as assessment of mother’s health).
Using the above monitoring points consistently, we can develop a sense of what is healthy and unhealthy, even if there isn’t a resource specifically for our species, breed, or region. Linking our observations to management decisions and behaviors then empowers us to make changes that support animal health, profitability, ecosystem function and our quality of life. Anyone managing browsing animals can reasonably expect to develop a sense of how much forage is available to browsing animals in a given time and place as long as they create and maintain the feedback loop and stay engaged in the ongoing and adaptive planning and replanning process.

By engaging with feedback loops, we quickly become primary expert resources to better help ourselves and others improve our management effectiveness over time. What matters is that we start the process and stick with it. I often liken it to learning how to partner dance, in that it will always feel awkward at the beginning, but if you stick with it, you’ll develop a flow and an ongoing physical dialogue. Perfection is our enemy in the participatory stewardship of ever-evolving complexity, because it either prevents us from starting, or it stops us from continuing once we think we have things “figured out.” Systematizing our relationship with complex systems may seem efficient at first, but it can quickly create all sorts of expensive, time-consuming unintended consequences. It seduces us into ignoring the all-important feedback loop that involves continuous monitoring and adaptation of our plans. On the other hand, the lack of an easy measurement system for browsing animals actually serves as a psychological benefit because it means we have to depend upon the deeper principles of holistically managing amidst complexity to estimate forage. It helps us stay connected and up-to-date with ever-changing conditions. It’s never boring!
You can learn more about Holistic Planned Grazing in our upcoming Holistic Planned Grazing and Ecological Monitoring online course which takes place April 4- June 20, 2024. Learn more about this course.
Ethan Young is part of the UVE CREW and supports our Learning & Practice program. As a lifelong horticulturist, Ethan brings together his deep knowledge of permaculture and holistic management to assist stewards in ongoing training at the UVE Learning Site. He has worked across the US and Australia managing sheep, goat, cow herds and stockers. Ethan regularly contributes to education and community building efforts across the Pacific Northwest. Contact: ethan@uvehub.com